Nyyon · Blog
GTM goal calculator: the customers and visits a revenue target needs
A worked example in seven tables: from a yearly revenue goal to customers, visits, pool size and channel cost, with every formula shown so you can rerun it with your own inputs.
A revenue target of 1,200,000 a year, sold at 500 a month per customer, needs 200 customers, and at the sample funnel rates below those customers need about 33,334 visits to find. This page walks the arithmetic of a GTM goal calculator, one table at a time, so that you can rerun it with your own inputs. All amounts are in plain currency units. The inputs are sample values chosen to make the arithmetic easy to follow, and each one is a placeholder for your own number.
Nyyon is a forward-deployed AI consultancy. The method below comes from our beachhead work, where goal math, funnel math and channel math run in a live spreadsheet. We publish the arithmetic as tables here and keep the calculator as a worked example, so every figure on this page can be checked by hand.
Step 1: How many customers does the goal need?
Turn the revenue goal into a sales constraint with three divisions.
| Input or result | Formula | Sample value |
|---|---|---|
| Annual run-rate goal | input | 1,200,000 |
| Ticket per customer per month | input | 500 |
| Window to reach the goal | input | 4 months |
| Monthly revenue needed | goal divided by 12 | 100,000 |
| Customers needed | monthly revenue divided by ticket, rounded up | 200 |
| New customers per month, flat | customers divided by window | 50 |
Flat adds are a fiction when channels need time to build. A ramp reflects how channels behave: the last month carries the most customers and sets the capacity the channels must deliver. Our default ramp is 10, 20, 30 and 40 percent of the customers across the four months.
| Month | Share of customers | New customers | Cumulative customers |
|---|---|---|---|
| 1 | 10 percent | 20 | 20 |
| 2 | 20 percent | 40 | 60 |
| 3 | 30 percent | 60 | 120 |
| 4 | 40 percent | 80 | 200 |
Month 4 needs 80 new customers, which is 60 percent more than the flat plan's 50. The channels have to be sized for 80.
Step 2: How many visits does the funnel need?
Define funnel stages by the product's own events. Back-solve from the customers needed: divide by the product of the rates after each stage.
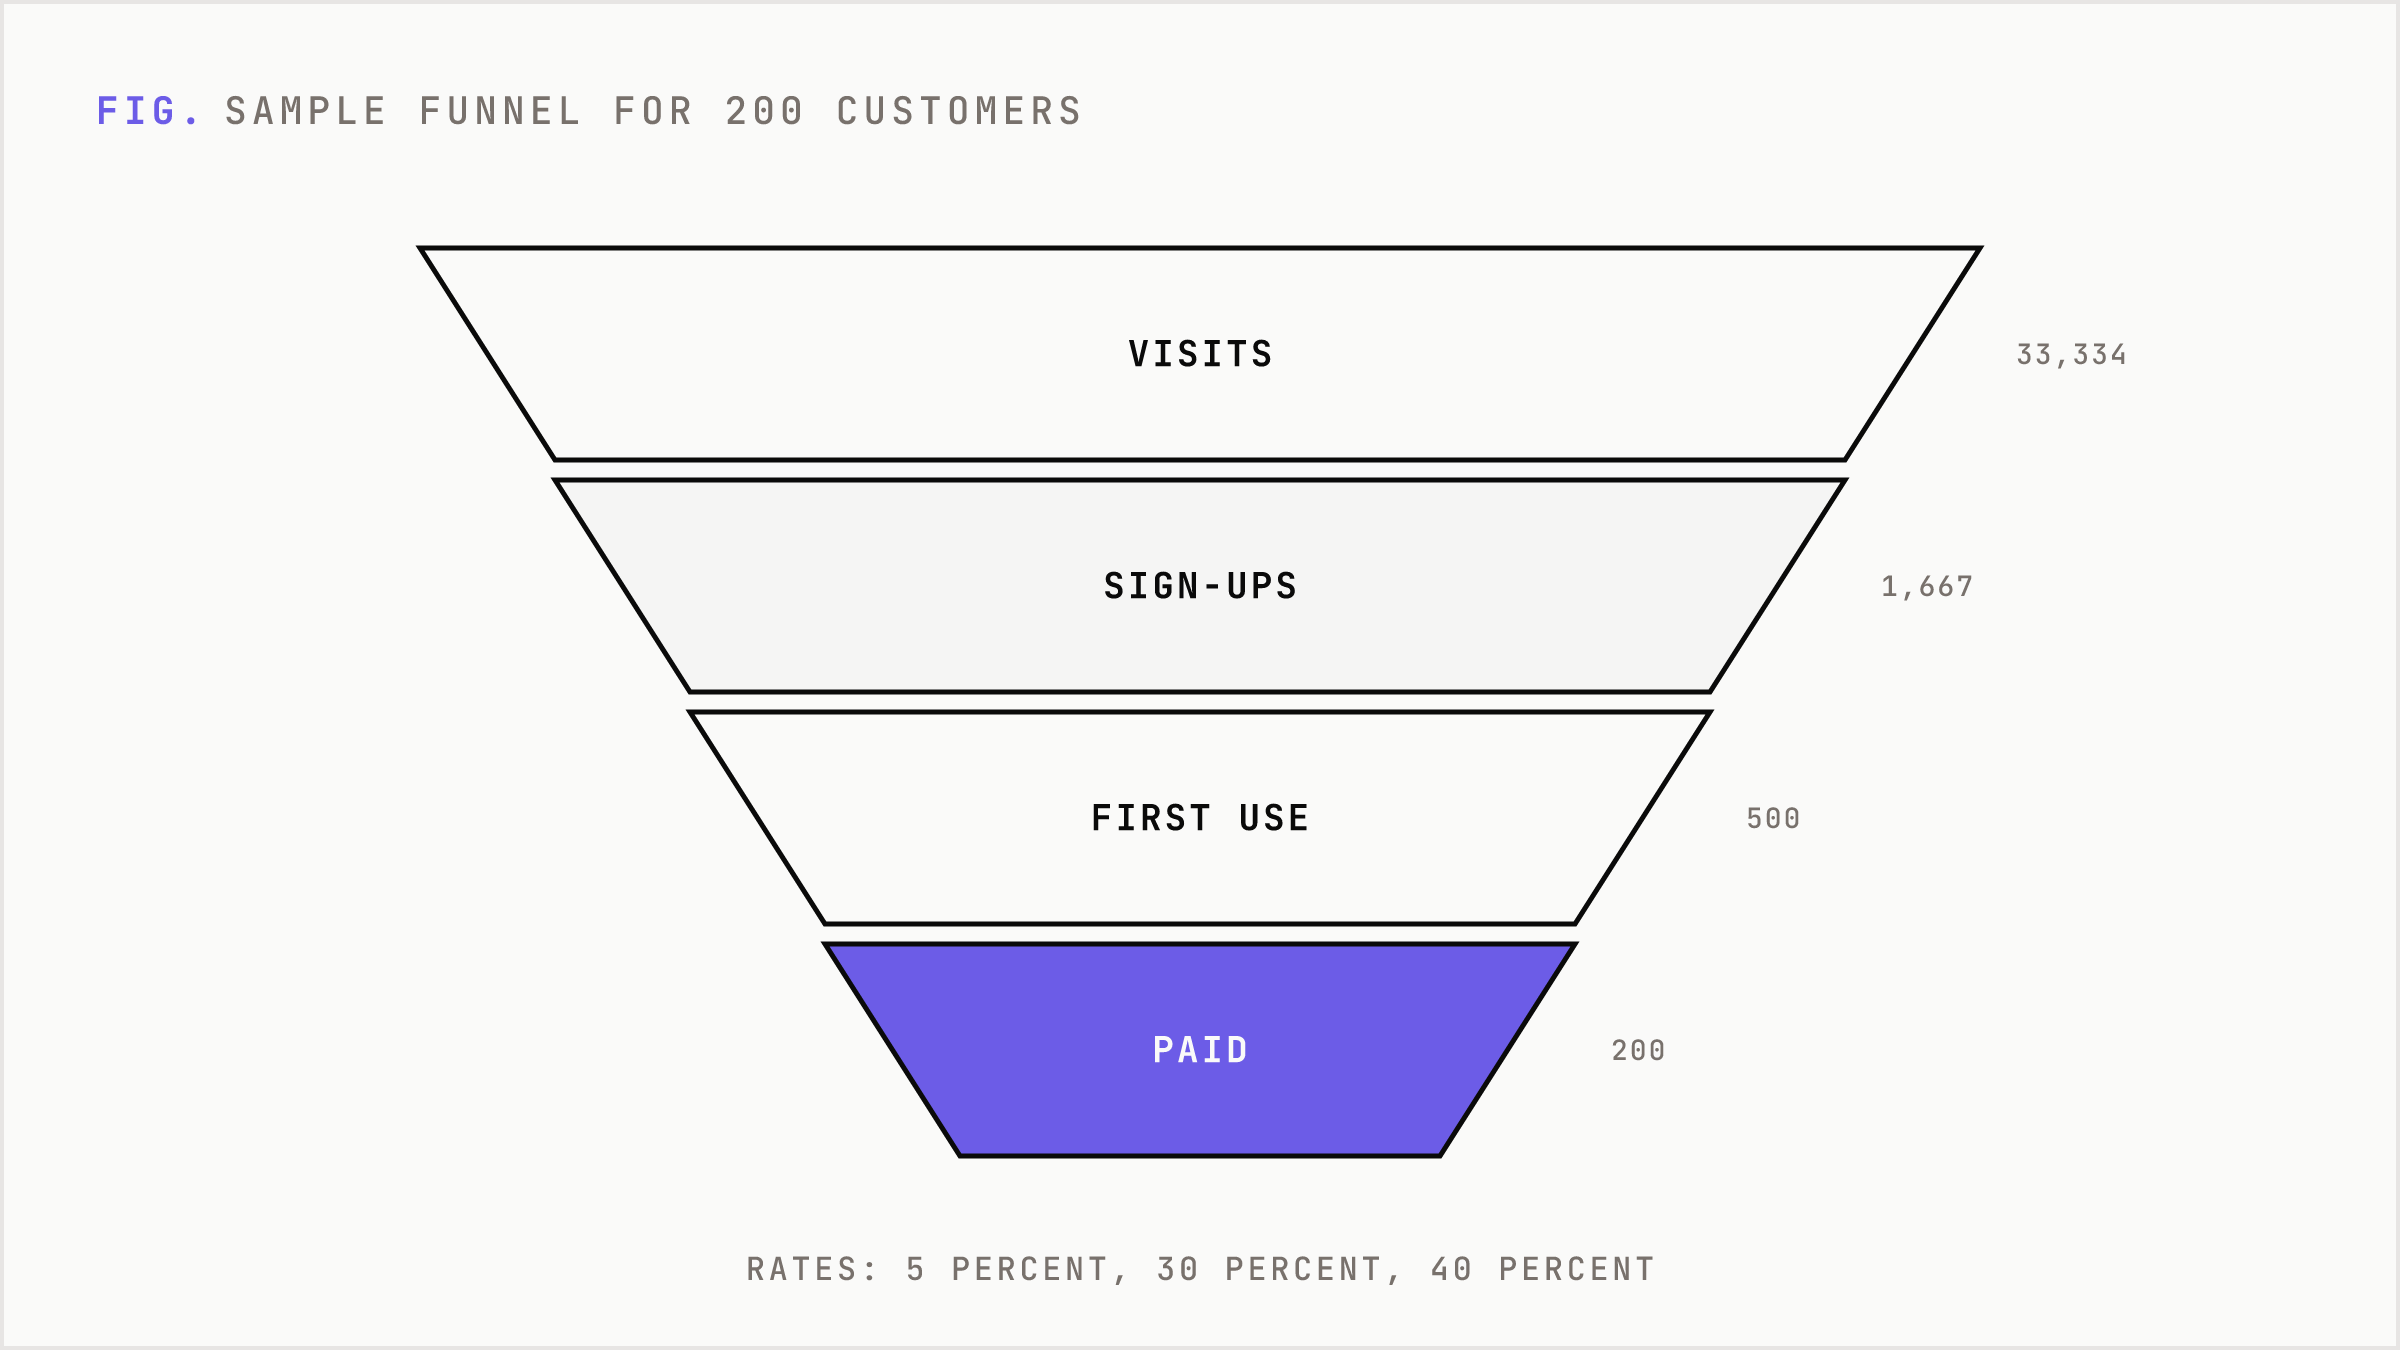
| Stage | Rate to the next stage | People needed at this stage |
|---|---|---|
| Visit to sign-up | 5 percent | 33,334 visits |
| Sign-up to first use | 30 percent | 1,667 sign-ups |
| First use to paid | 40 percent | 500 first uses |
| Paid customers | 200 customers |
The three rates multiply to 0.6 percent, so one visit in about 167 ends as a paying customer. The chain from sign-up to paid alone is 12 percent (30 percent times 40 percent), and that is the net rate every channel that buys sign-ups inherits.
Step 3: What does a reality pass change?
Landing-page conversion borrowed from a cross-industry median is the input most likely to sit above what your motion delivers. A reality pass reruns the funnel with a more cautious rate and keeps the customers and revenue fixed.
| Visit to sign-up rate | Visits needed | Compared with the sample plan |
|---|---|---|
| 5 percent | 33,334 | baseline |
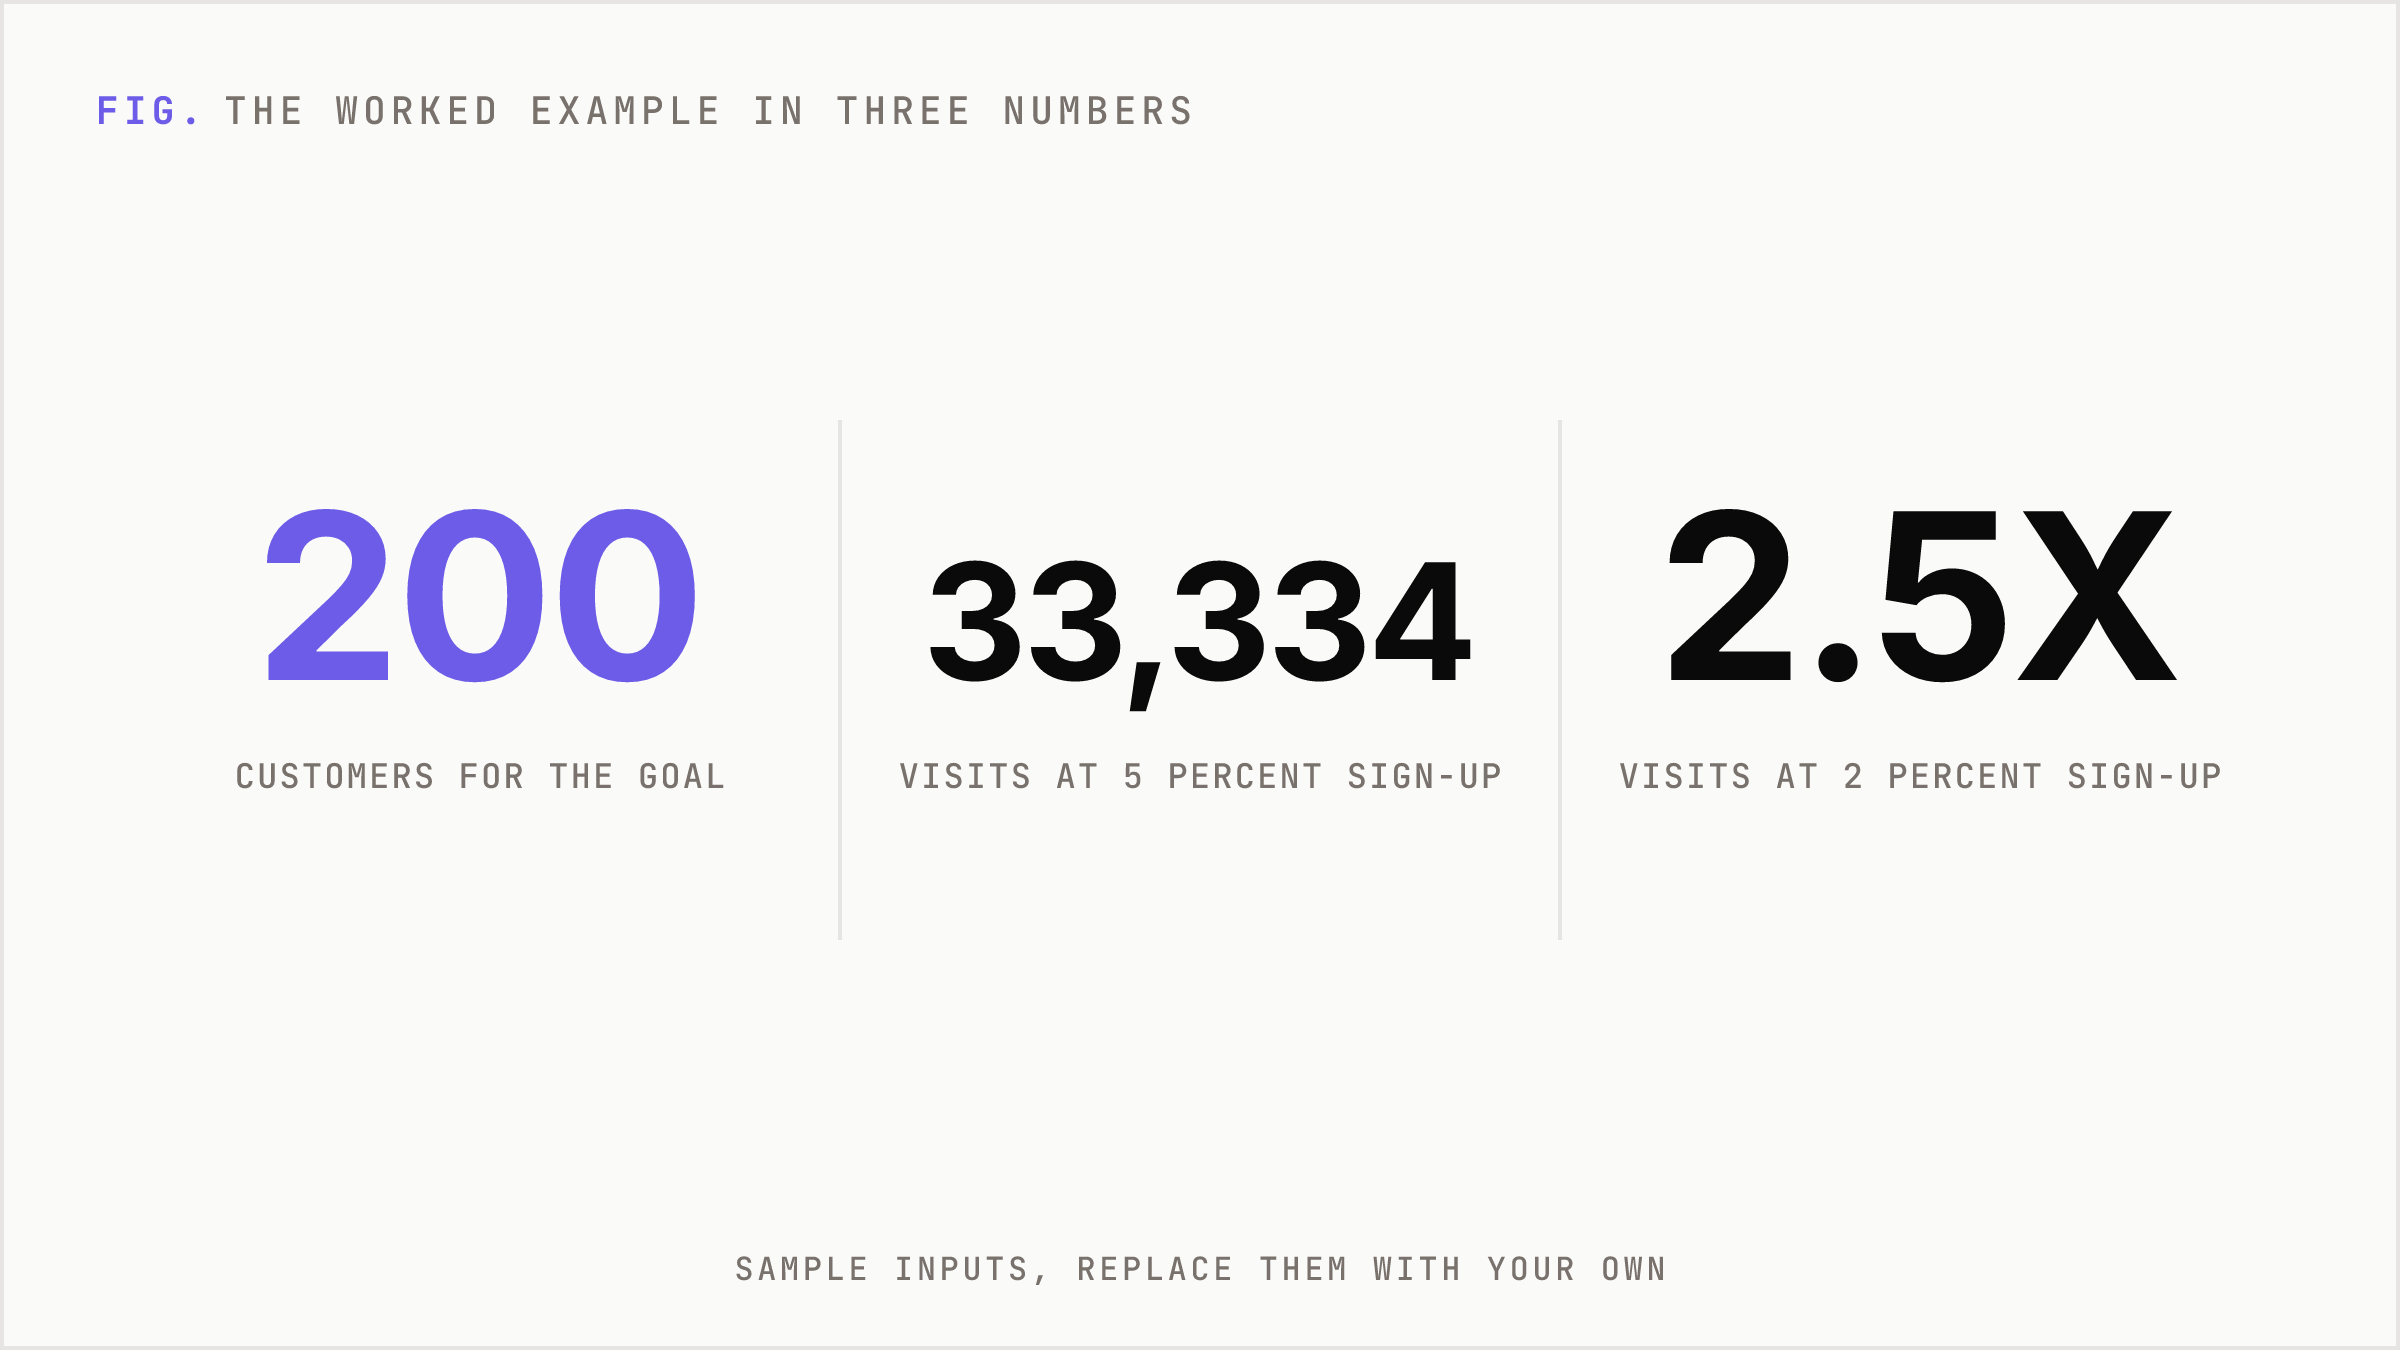
| 2 percent | 83,334 | 2.5 times as many |
| 10 percent | 16,667 | half as many |
Halving the sign-up rate doubles the visits, and the relationship holds for every rate in the chain. Use real conversion data from your own analytics or CRM wherever you have it, and fill the gaps with published benchmarks for the closest comparable motion.
Step 4: Which input moves the answer most?
Change one input at a time and record the effect on the customers or visits needed.
| Changed input | Sample value | Result |
|---|---|---|
| Ticket per month | 250 | 400 customers, 100 new per month on the flat plan |
| Ticket per month | 1,000 | 100 customers, 25 new per month on the flat plan |
| Sign-up to first use | 15 percent | 66,667 visits |
| Sign-up to first use | 45 percent | 22,223 visits |
| First use to paid | 20 percent | 66,667 visits |
| First use to paid | 60 percent | 22,223 visits |
The ticket scales the customer count in inverse proportion, and each funnel rate scales the visit count in inverse proportion. A change of any single input by a factor of two changes the answer by a factor of two. That is why the ticket deserves the most care, because it sets the customer count that every later step inherits.
Step 5: Does the segment have enough buyers?
The penetration test divides the customers you need by the number of firms you can reach in the buyer's size band.
| Reachable pool | Customers needed | Share of the pool |
|---|---|---|
| 8,000 firms | 200 | 2.5 percent |
| 4,000 firms | 200 | 5 percent |
In our method a share above roughly 3 to 4 percent marks a segment as too concentrated for a beachhead. At that threshold of 3 percent, the pool must hold at least 6,667 firms for 200 customers. Take the pool size from a primary count, such as a census table, a registry or a directory filtered to the size band, and say so when the filter is an estimate.
Step 6: What does a channel cost to feed the funnel?
A channel that buys sign-ups needs 1,667 of them. Three sample cost levels per sign-up show how the spread drives acquisition cost and payback.
| Cost per sign-up | Spend for 1,667 sign-ups | Cost per customer | Payback in months | Return over 12 months |
|---|---|---|---|---|
| 80 | 133,360 | 667 | 1.3 | 9.0 times |
| 120 | 200,040 | 1,000 | 2.0 | 6.0 times |
| 180 | 300,060 | 1,500 | 3.0 | 4.0 times |
The formulas: spend equals sign-ups times cost per sign-up. Cost per customer equals spend divided by customers. Payback in months equals cost per customer divided by the monthly ticket. Return over 12 months equals customers times ticket times 12, divided by spend. That last figure assumes all 200 customers pay for all 12 months, so it flatters a ramped plan.
Bring your own inputs to a 30-minute call and we will rerun this arithmetic on your goal, ticket and funnel.
What does the arithmetic leave out?
The tables give a first answer and the following items change it:
- Churn. Small buyers on monthly plans leave, so holding the target requires replacements each month. Add a churn allowance sourced for your field.
- Capacity. A channel has a finite inventory of placements, and a seller has a finite number of meetings per week.
- Entry stage. An outbound meeting enters the funnel closer to the paid stage than a cold sign-up does, so model it at the right stage or with an explicit quality multiplier.
- Support. Two hundred small customers generate support load that a flat plan hides.
- Total cost. Compare the plan against the status quo and the alternatives over the buyer's real horizon.
Where does this calculator fit?
The tables above cover the goal, funnel and channel stages of a go-to-market engagement. Our post on what drives the cost of a GTM sprint lists the eight drivers of effort. The arithmetic here shows what two of them, the goal and the funnel, look like on paper.
About Nyyon
Nyyon is a forward-deployed AI consultancy, also described as an AI execution partner. It takes the important operational project nobody has time to own and hands it back as a working system the team runs. Nyyon works with founder-led companies in North America and with department leaders who hold an AI mandate and lack the capacity to execute. Engagements run as a Skip-the-spec Retainer, a Project Sprint, or a Forward Deployed AI Expert engagement.