Nyyon · Blog
The Fastest Data Is the Data You Never Process
Cut data costs and speed reporting by reducing scans, shuffles, full refreshes, small files, and repeated transforms before buying more compute.
Data performance is not a compute problem first. It is a waste problem.
Most companies react to slow dashboards, lagging pipelines, and missed reporting windows by buying more capacity. Bigger warehouse. Larger cluster. More slots. More executors. Higher tier.
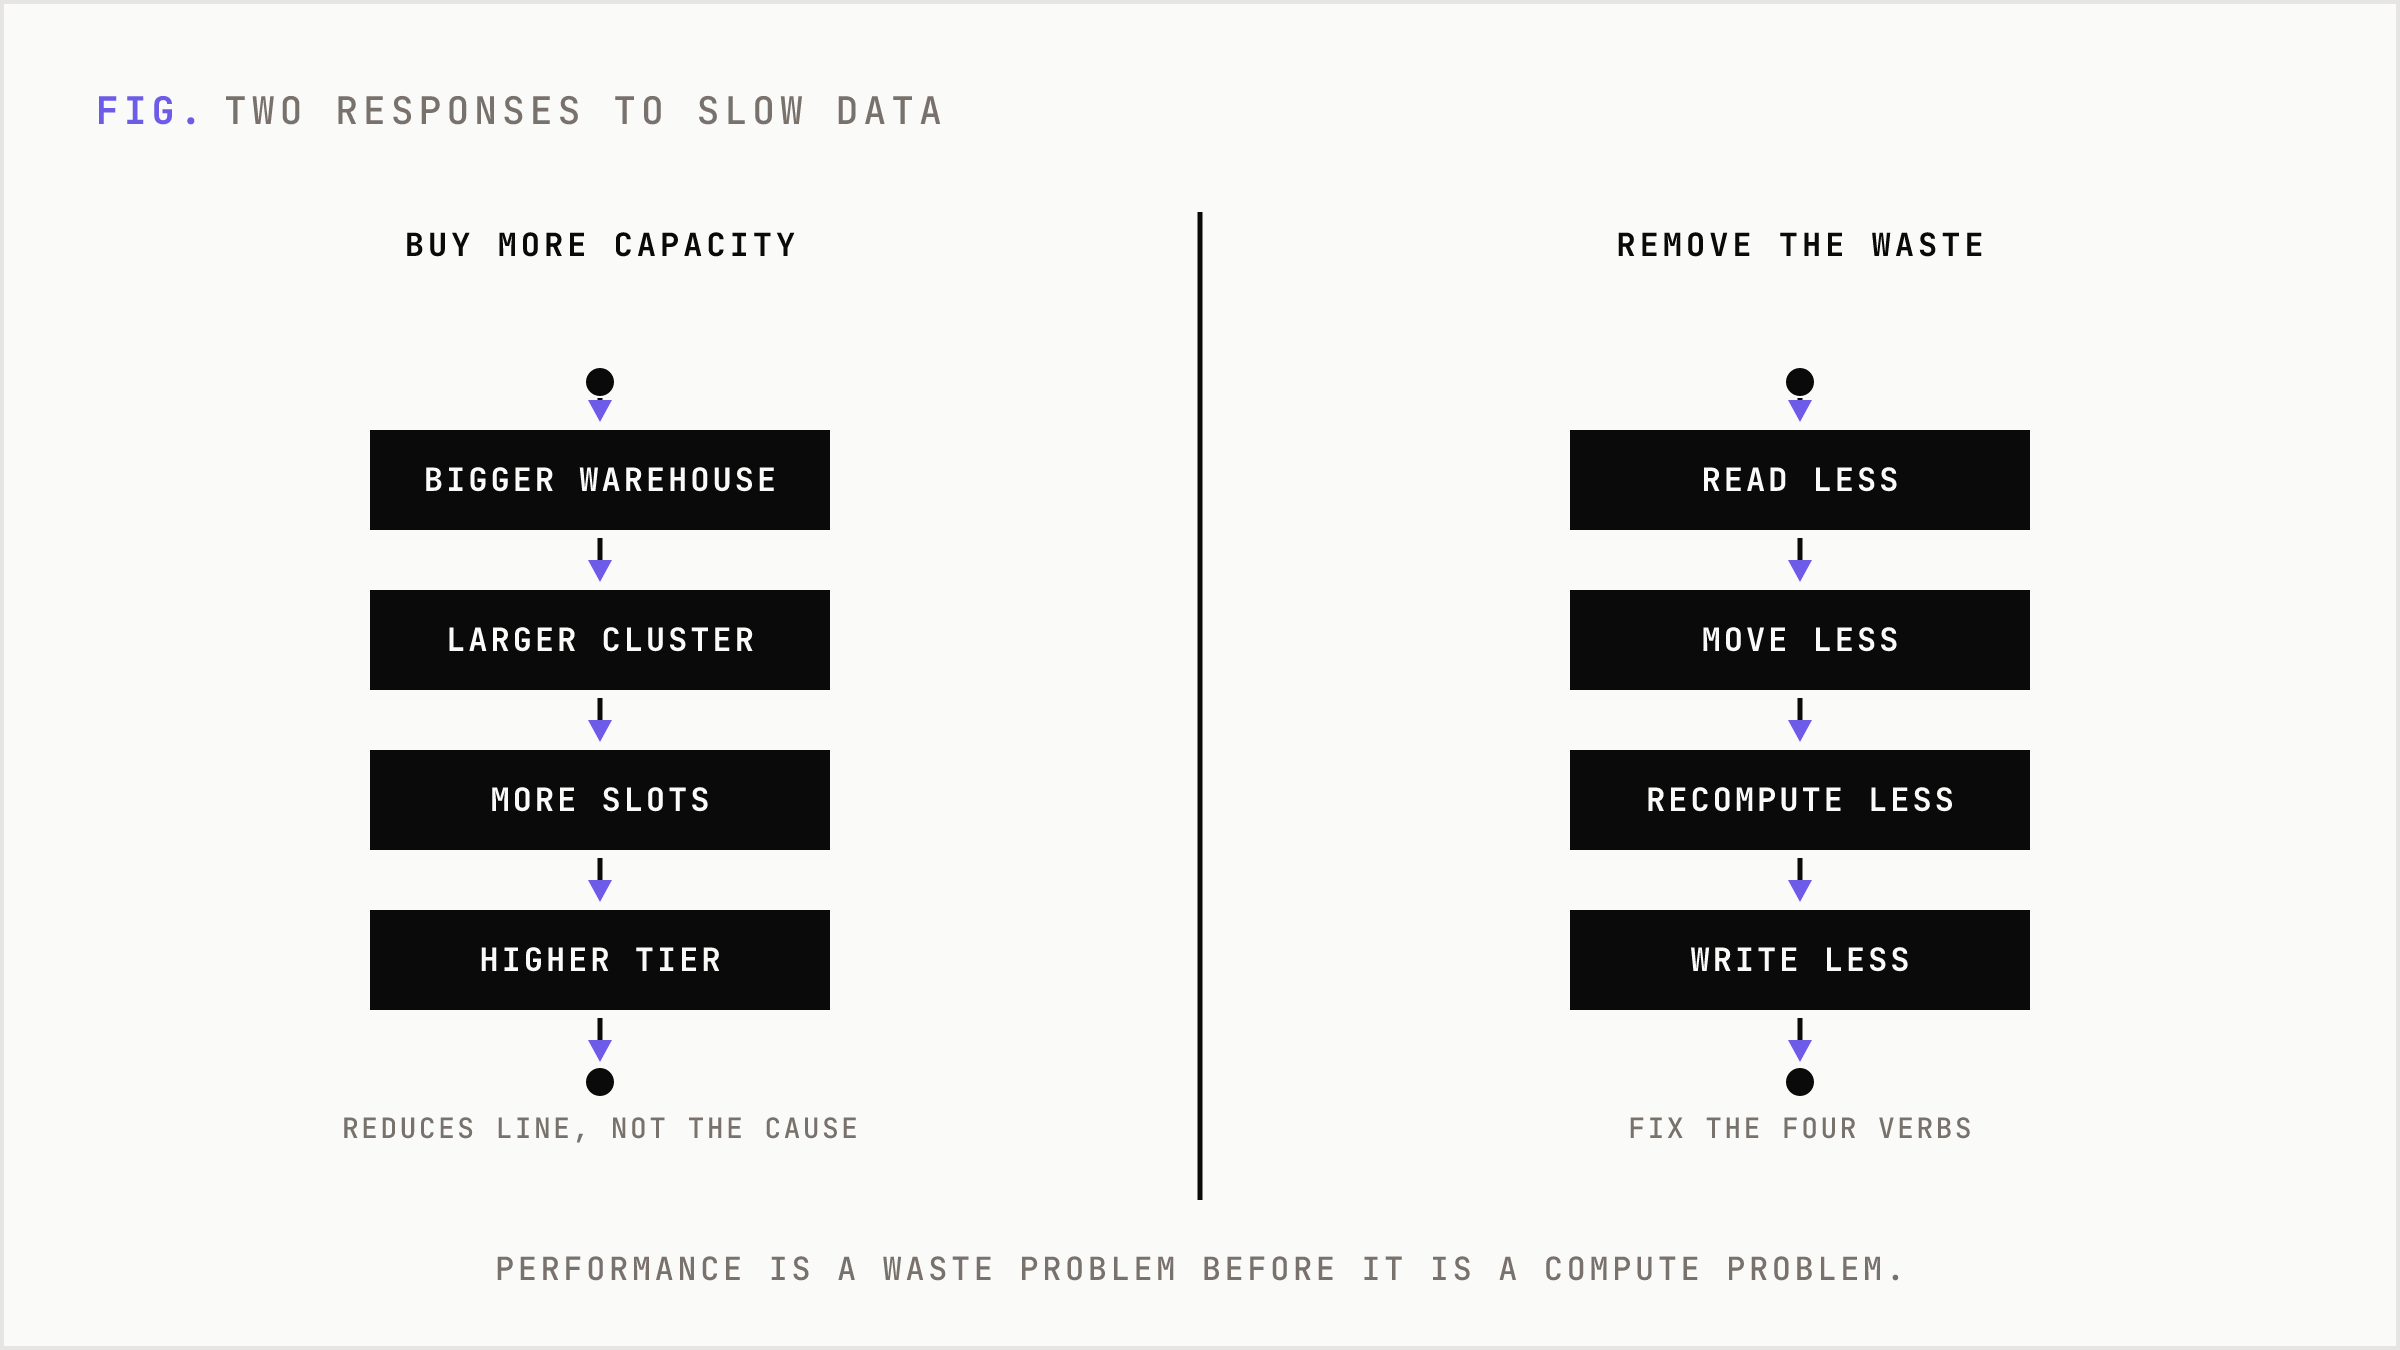
That works in the same way opening another checkout lane works when the store layout is broken. It may reduce the line. It does not fix the reason customers are wandering in circles.
The better question is colder: how much data did we force the system to touch that had no chance of changing the answer?
That number is the real performance budget.
The Unit Economics of Wasted Data
Every analytics system has a hidden bill of materials. Bytes scanned. Bytes shuffled. Bytes written. Files opened. Rows serialized. Partitions scheduled. Intermediate tables materialized. Failed tasks retried. State checkpointed. Results copied into another tool.
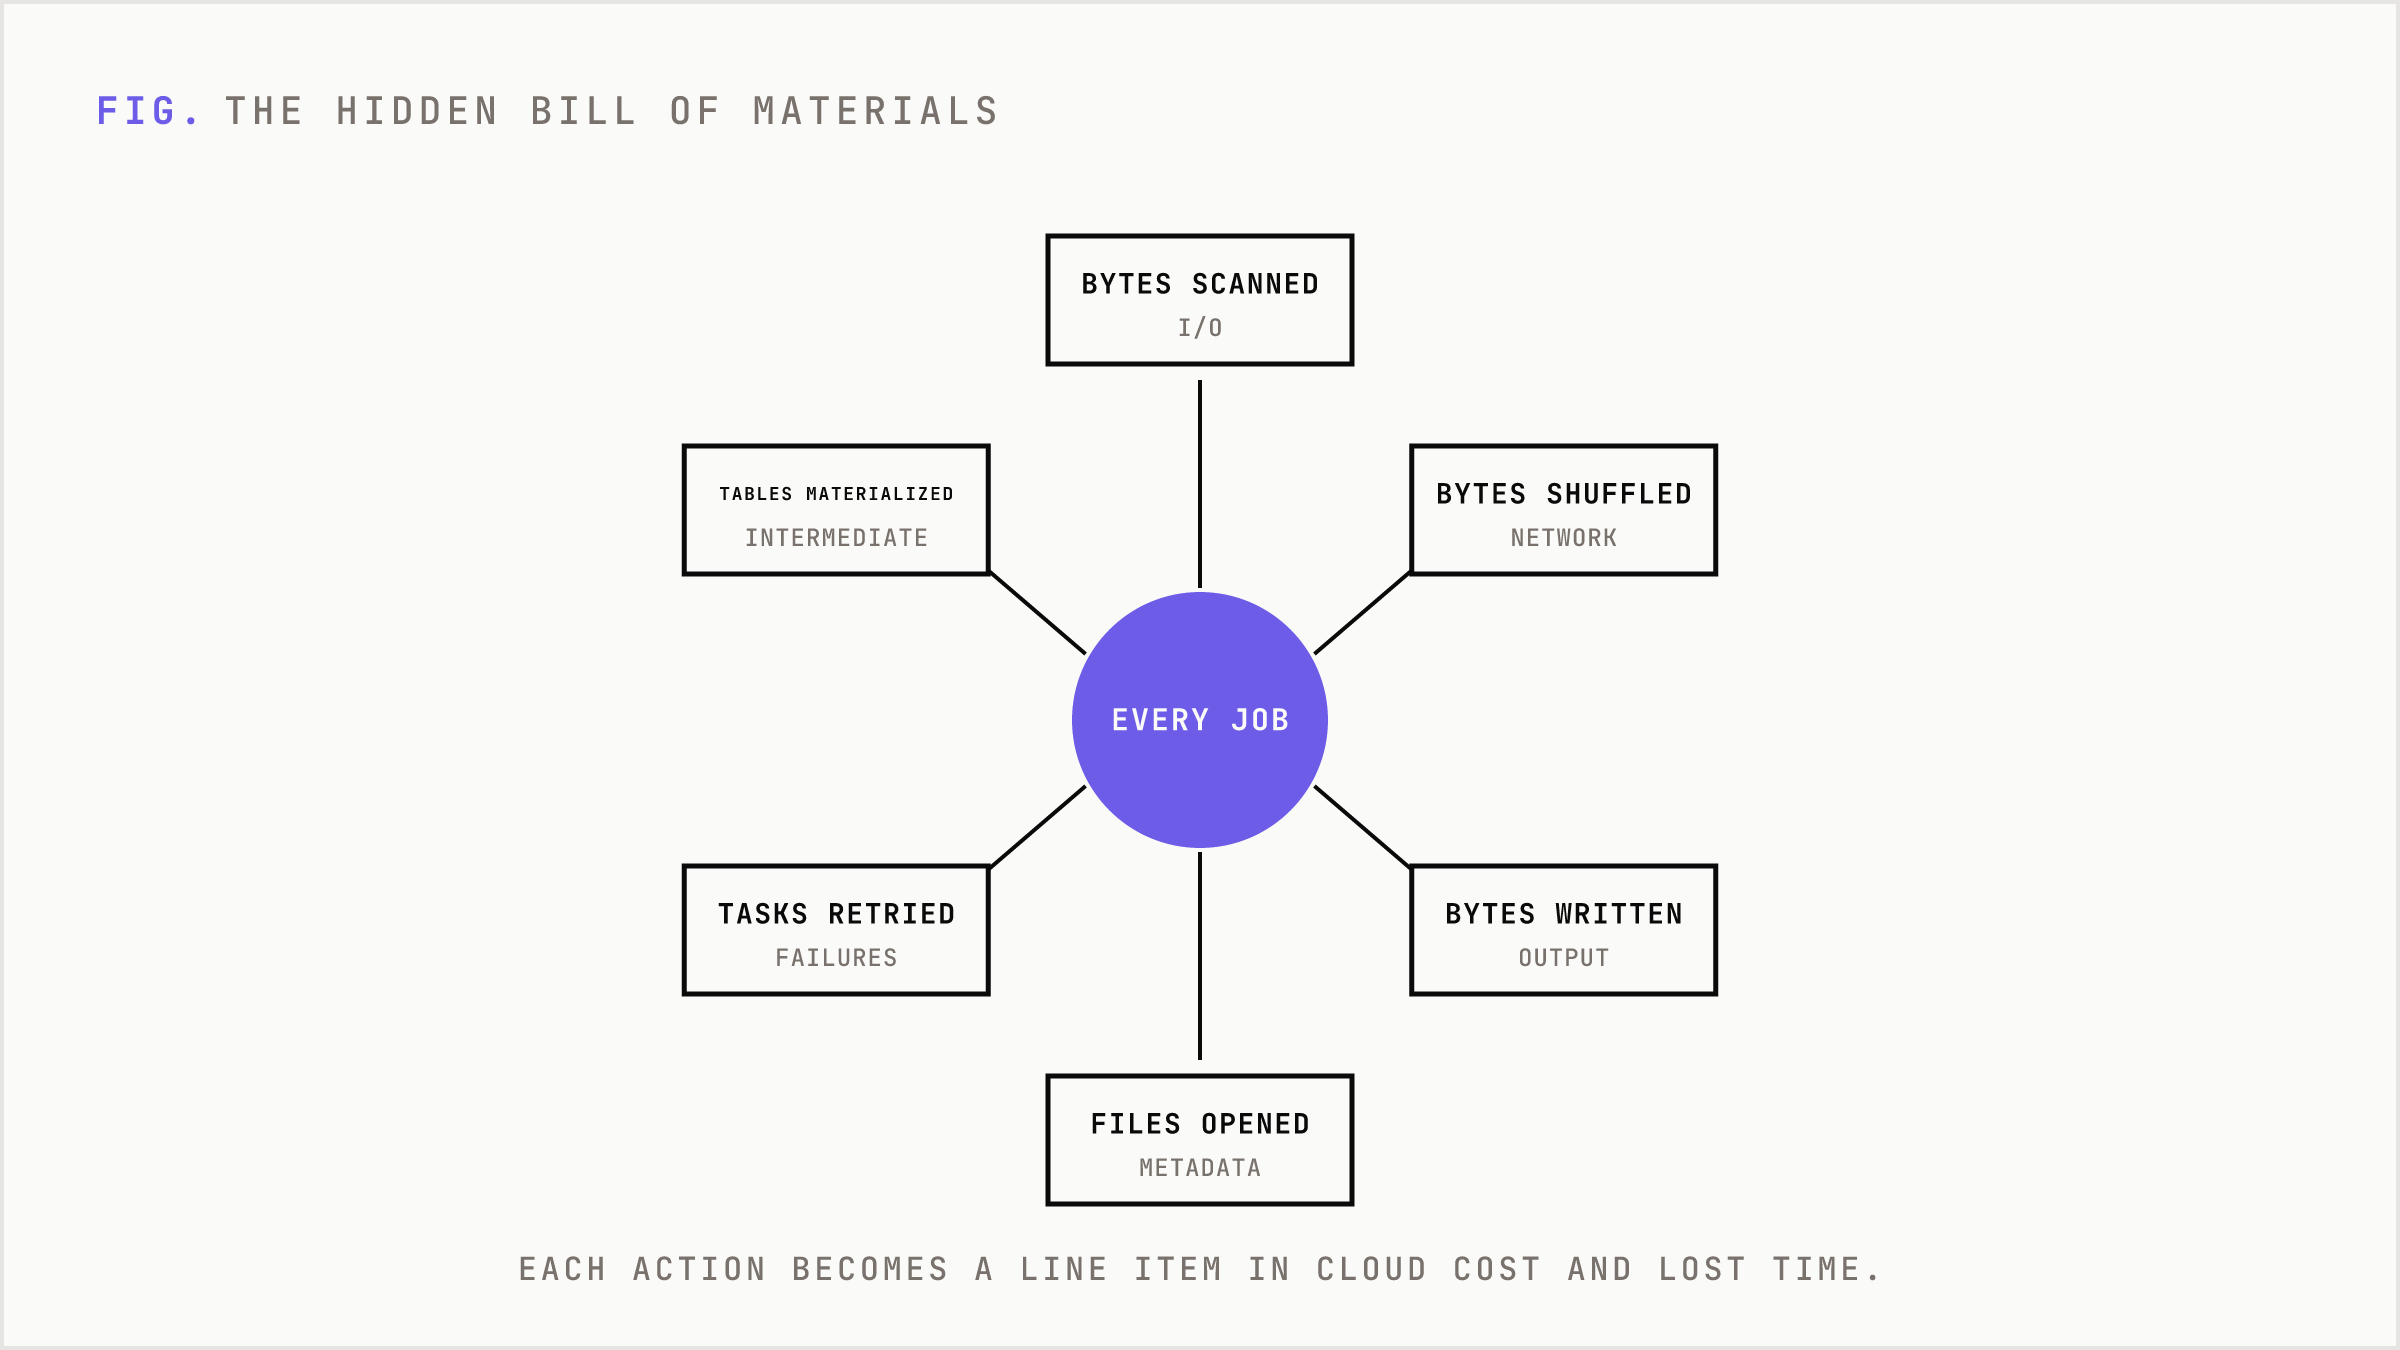
None of this is abstract. In cloud data platforms, these actions turn into line items. In marketing and analytics teams, they turn into delayed budget reads, stale campaign decisions, and analysts waiting for jobs instead of changing allocation.
The market logic is simple. If a team cannot trust its reporting cycle, it compensates with buffers. It reviews spend later. It launches experiments slower. It narrows the number of segments it can manage. It accepts coarser targeting because the measurement layer cannot keep up.
Slow data does not just cost compute. It changes behavior.
Buyers feel this before they can diagnose it. The CMO sees Monday reporting arrive Tuesday. The finance lead sees warehouse spend rise without a matching increase in output. The growth team sees attribution models refresh overnight when the media market moved six hours ago. The data team sees dashboards blamed for decisions that were already stale.
The waste is usually mechanical. It is not mysterious. The system reads too much, moves too much, recomputes too much, and writes too much. Fix those four verbs and most performance conversations change.
Read Less Before You Run Faster
The first principle is brutal: the fastest data is data never read.
A query that touches 200 columns to answer a question about five columns is not analytics. It is a tax. Columnar formats like Parquet exist because analytical questions are usually narrow. They need a slice of columns across many rows, not every field in every record.
This is why SELECT * is not a style issue. It is a budget issue. In platforms like BigQuery, adding LIMIT to SELECT * does not magically reduce the underlying bytes read. The system may still need to scan the columns. The cheaper move is to ask for the fields you actually use.
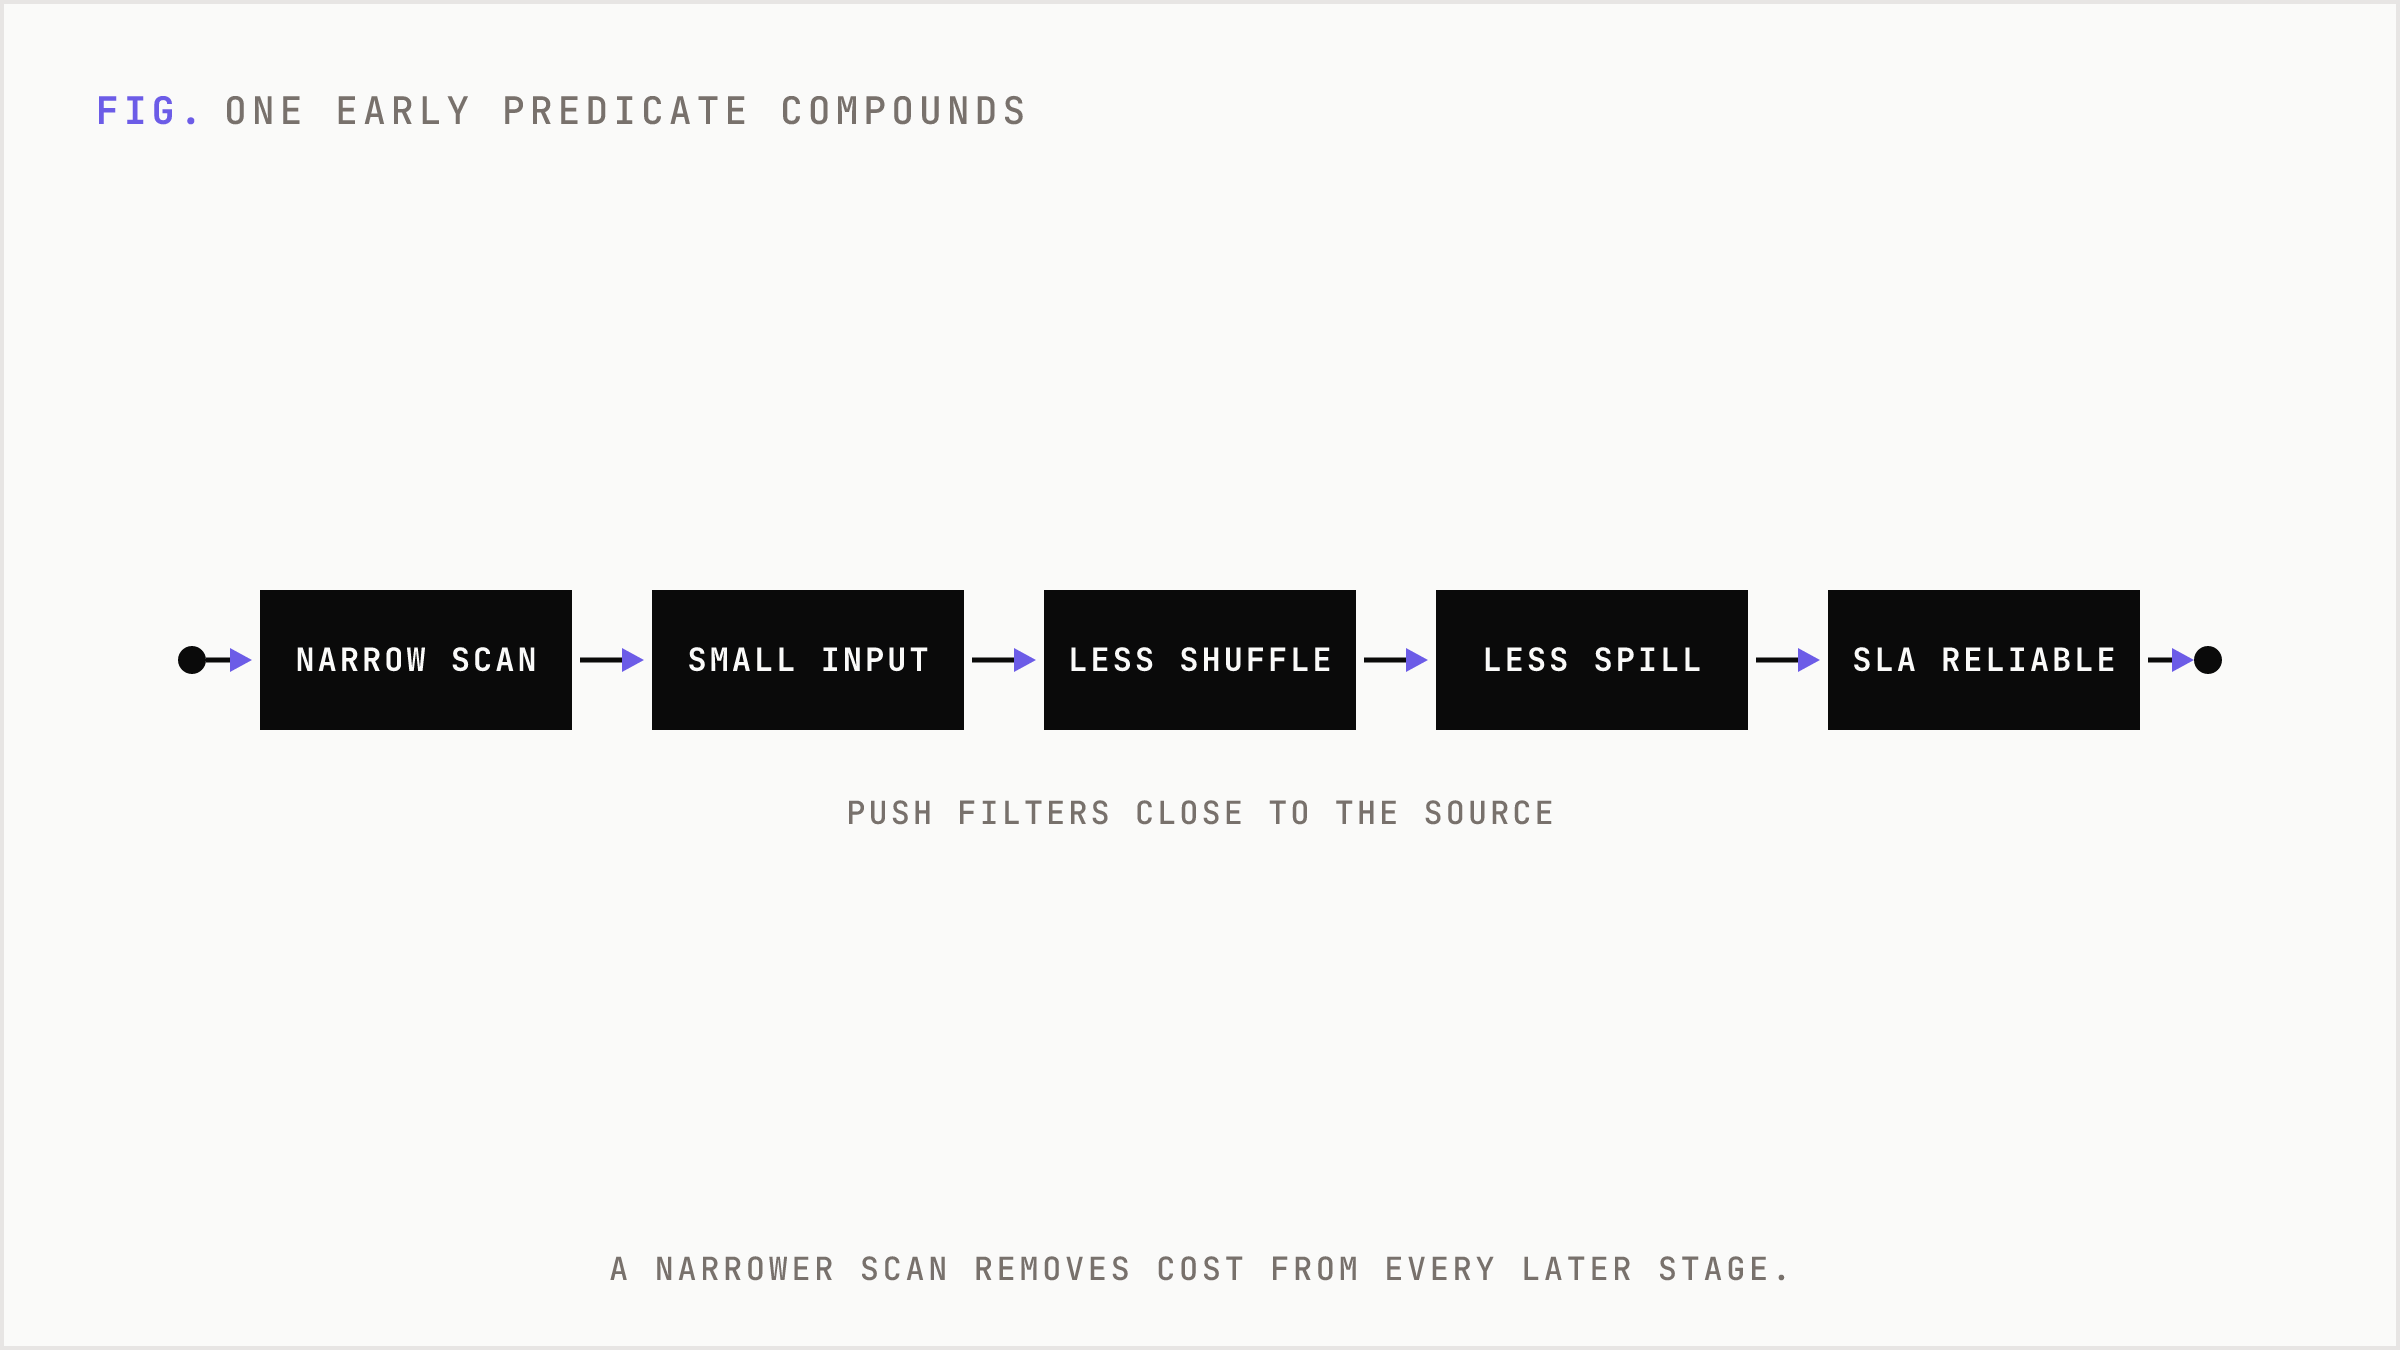
The same logic applies to filters. A filter after a join is often a late apology. If 90 percent of rows can be removed before the join, remove them before the join. Push date windows, customer segments, campaign IDs, region filters, and event type filters as close to the source as possible.
This sounds small until it compounds. A narrower scan reduces I/O. A smaller input reduces shuffle. A smaller shuffle reduces spill. Less spill reduces task time. Shorter tasks reduce retry exposure. Lower retry exposure improves SLA reliability. One early predicate can remove cost from five later stages.
Movement Is the Expensive Middle
After scanning, the next enemy is movement.
Distributed systems are strong because they split work. They are weak when they need to reorganize that work. Joins, group-bys, global sorts, deduplication, and window functions often require data to move across machines. That movement is the shuffle.
Shuffle is where clean SQL becomes physical reality. A join between a large events table and a large user table is not just a logical match. It is a network operation, a memory operation, a partitioning operation, and often a spill-to-disk operation.
The cure is not always fewer joins. It is better joins.
Pre-aggregate before joining when the detail is not needed. Join a daily campaign summary to a budget table instead of joining every impression event and aggregating later. Broadcast a small dimension table when the engine can safely copy it to workers and avoid a large shuffle. Reduce row width before the join. Do not carry JSON blobs, unused text fields, or debug columns through a wide transformation.
Skew is the more subtle version of the same problem. Average task time lies when one hot key holds half the work. A campaign, tenant, customer, or country can dominate a partition while the rest of the cluster idles. The dashboard says the job is running. In reality, most machines are waiting for one overloaded task.
That is not a reason to buy a bigger cluster. It is a reason to isolate hot keys, salt them, change the join strategy, or use adaptive query execution where available.
Layout Is Strategy
Data layout sounds like plumbing. It is strategy.
Partitioning, clustering, sorting, Z-ordering, compaction, and file sizing determine how much work the engine can skip. Skip enough work and performance improves without changing the query or adding compute.
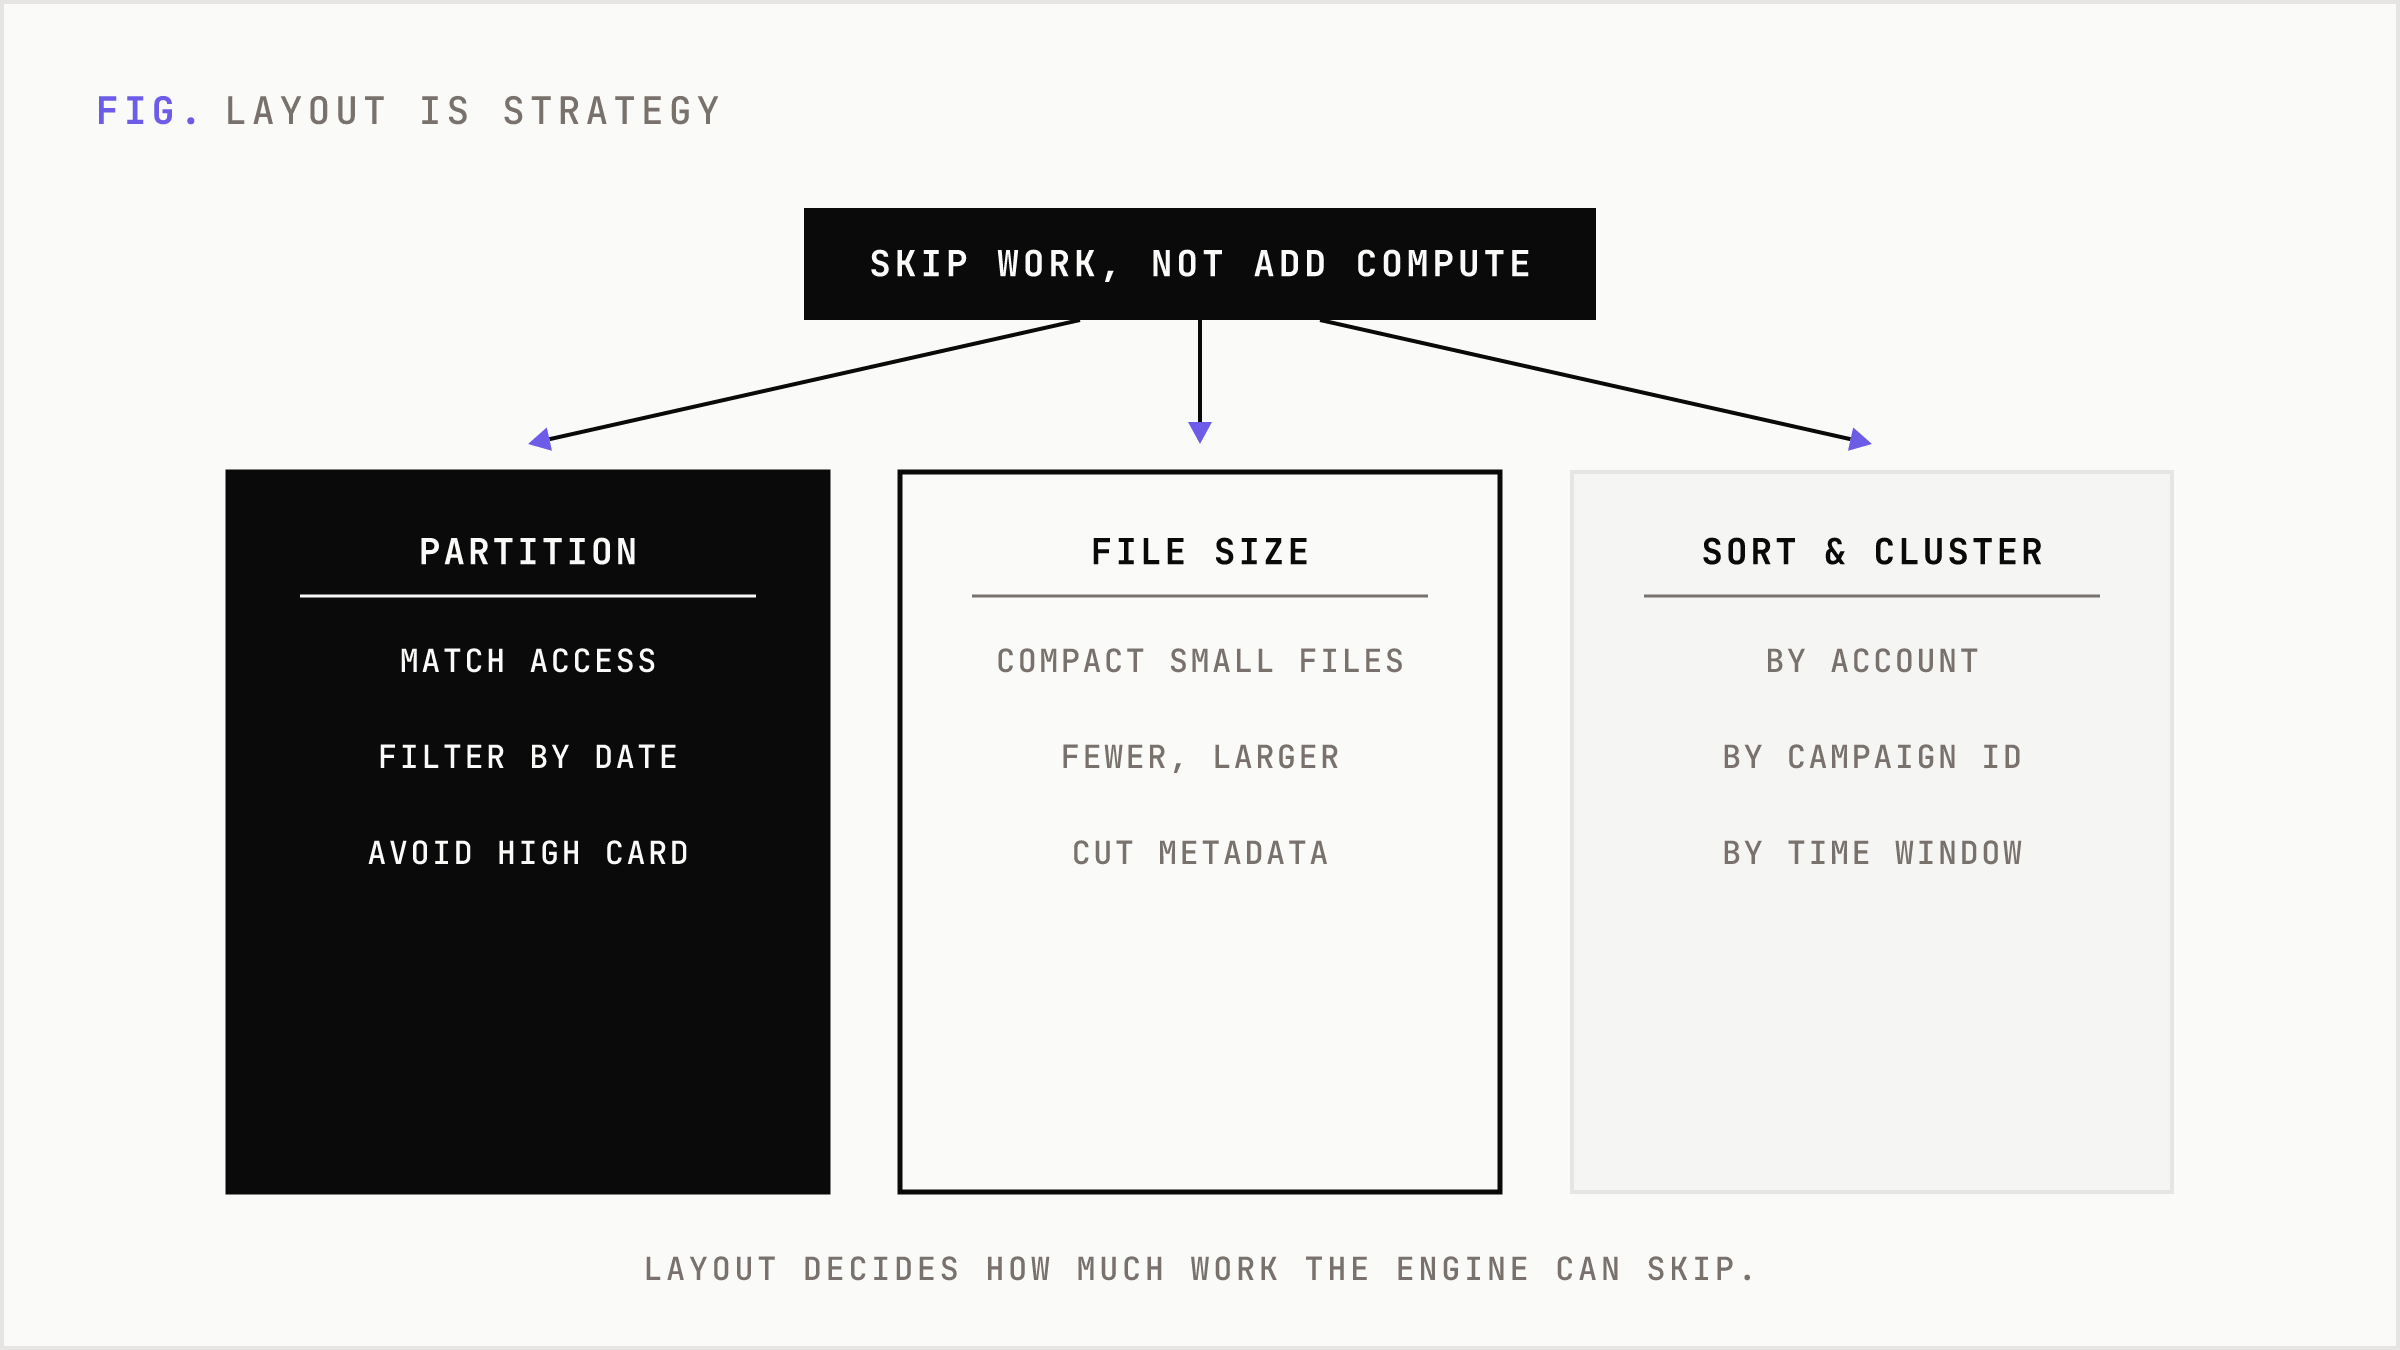
Partitioning is powerful when it matches access patterns. If most queries filter by event date, partition by date. If analysts rarely filter by user ID, do not create millions of user ID partitions. High-cardinality partitions turn storage into a metadata problem. You save nothing if every query opens a long tail of tiny fragments.
File size matters for the same reason. Many small files punish distributed engines with metadata overhead, scheduling overhead, and file-open cost. The system spends too much time preparing to work. In lakehouse environments, compaction is often one of the least glamorous and highest-return maintenance jobs. It rewrites small files into fewer, larger, more balanced files.
Sorting and clustering are the next layer. If a sales team constantly filters by account, region, and date, physical layout should reflect that. If growth analysts repeatedly join by campaign ID and time window, layout should make those reads cheap. ClickHouse, Delta Lake, BigQuery, Snowflake, and other systems expose different knobs, but the commercial principle is the same: common questions deserve physical advantage.
Full Refresh Is a Luxury
Full refreshes are easy to reason about and expensive to repeat.
They are defensible for small datasets, unstable logic, or periodic rebuilds. They are dangerous as a default operating model. If yesterday's billion rows did not change, reprocessing them to add today's million rows is waste with a schedule.
Incremental processing changes the contract. Instead of rebuilding the world, the pipeline handles new and changed records. dbt incremental models, merge patterns, high-water marks, and change data capture all express the same idea: process the delta, not the archive.
This matters most in marketing systems because latency changes decision quality. Campaign budgets, lead scoring, lifecycle triggers, audience suppression, and experimentation all depend on recent data. A nightly full refresh that grows from 40 minutes to four hours is not just slower. It narrows the window for action.
The implementation detail matters. Incremental filters should appear early in the model, not at the end of a long chain of common table expressions. Unique keys matter when updates and deduplication are required. Without a real key, many pipelines quietly append duplicates and call it freshness.
Repeated Transformations Are Silent Burn
Some work should not be repeated.
Regex parsing, JSON extraction, UDFs, identity resolution, sessionization, feature generation, and enrichment logic can become hidden tax if every downstream query repeats them. A dashboard that parses raw event properties on every load is not flexible. It is borrowing cost from the warehouse.
Materialize expensive repeated work when the reuse is real. Persist cleaned fields. Store canonical dimensions. Build intermediate tables for transformations that many teams consume. Use materialized views when repeated joins and aggregations fit the engine's strengths.
This is not an argument for materializing everything. Materialization creates storage cost, freshness rules, dependency management, and failure modes. The test is frequency multiplied by cost multiplied by business sensitivity. A transformation used hourly by revenue, finance, and growth deserves a different design than a one-off analyst query.
Streaming Is Bottleneck Management
Streaming does not repeal the physics. It makes the bottlenecks more visible.
Throughput and latency trade against each other. Larger batches improve compression and network efficiency. They also add bounded delay. Kafka's batching settings, compression choices, and producer behavior are not tuning trivia. They shape the economics of real-time systems.
Backpressure is the streaming version of truth. If downstream operators cannot consume as fast as upstream operators produce, lag grows. The cause might be a slow sink, an under-parallelized function, a hot key, large state, checkpoint delay, or an external database that cannot absorb writes.
State is where streaming cost often hides. Unbounded windows, missing TTLs, high-cardinality keys, and large timers turn a clean event pipeline into a growing liability. Checkpoint duration, alignment time, state backend I/O, and sink commit time should be treated as business telemetry, not engineering trivia.
A real-time system that cannot explain its lag is not real-time. It is delayed batch with a harder failure mode.
The Diagnostic Order
Founders and executives do not need every tuning knob. They need the order of operations.
- Measure first. Inspect query plans, job stages, row counts, scan bytes, shuffle bytes, spill, skew, CPU, memory, retries, and wall time.
- Process less. Remove unused columns, push filters upstream, prune partitions, and avoid reading files that cannot contribute.
- Move less. Pre-aggregate, broadcast small tables, reduce row width, and fix join order.
- Recompute less. Use incremental models, materialized transforms, high-water marks, and CDC.
- Improve layout. Compact files, choose sane partitions, cluster by access patterns, and maintain statistics.
- Tune compute last. Change memory, CPU, executors, slots, and parallelism after waste has been removed.
This order matters because it protects capital discipline. More compute is the easiest purchase and often the weakest fix. It scales the waste along with the workload.
Why This Becomes an AI Problem
The next phase of data optimization will not be a human memorizing more best practices. The surface area is too large. Warehouses, lakehouses, stream processors, BI tools, orchestration systems, and campaign platforms all emit telemetry. The problem is joining that telemetry into a decision.
An AI-native optimizer should not give generic advice. It should read the query, the plan, the schema, the table sizes, the partitioning, the file counts, the runtime history, the cost history, and the SLA. Then it should rank actions by expected byte reduction, shuffle reduction, cost reduction, implementation risk, and rollback complexity.
That is the difference between a tip and an operating system.
Bad answer: avoid SELECT *.
Useful answer: this dashboard scans 41 columns but renders seven, runs 480 times per week, and 62 percent of scanned bytes come from three unused nested fields. Replace the query projection, persist parsed campaign attributes, and validate against bytes scanned per refresh and p95 dashboard latency.
The second answer changes behavior because it is tied to money, frequency, and risk.
The Buyer Logic
Budget owners do not buy optimization because it is elegant. They buy it when the current system blocks throughput.
The buying trigger is usually one of five events: cloud data spend grows faster than revenue, reporting misses operating cadence, AI or personalization workloads increase data volume, a migration exposes broken pipelines, or a board-level metric becomes disputed because the data is late or inconsistent.
At that point, optimization competes with three substitutes: more compute, more headcount, or less ambition.
More compute is fast but compounds spend. More headcount helps but does not scale if engineers are manually firefighting every pipeline. Less ambition is common and expensive. Teams stop asking harder questions because the system punishes curiosity.
The durable product opportunity is to make the better path easier than the lazy path. Diagnose waste. Recommend changes. Estimate impact. Validate results. Keep a regression watch. Tie technical fixes to business metrics.
This expands the market because optimization stops being a senior data engineer's occasional cleanup project and becomes a continuous control layer for every team that depends on data.
The Management Test
Ask four questions in the next performance review.
- Which jobs cost the most per business decision supported?
- Which tables are scanned most often with the lowest column usage?
- Which pipelines still full-refresh data that changes incrementally?
- Which stages show skew, spill, retries, or output explosion?
If the organization cannot answer, it does not have a performance problem yet. It has a visibility problem.
Once the answers exist, the roadmap becomes obvious. Cut scans. Cut shuffles. Cut repeated transforms. Cut full refreshes. Fix layout. Then buy compute where it actually converts to speed.
This is not austerity. It is leverage.
Companies that process less useless data can ask more questions with the same budget. They can shorten decision cycles without hiring a parallel analytics team. They can run richer segmentation, faster experiments, and more reliable AI workflows because the data layer stops behaving like a drag coefficient.
The fastest data is the data you never process. The second fastest is data shaped so well that the system barely has to think.
FAQ
What does it mean to optimize data processing?
It means reducing wasted work across the pipeline: fewer bytes scanned, fewer bytes shuffled, fewer repeated transformations, fewer full refreshes, better file layout, and less retry waste.
Why is adding more compute often the wrong first move?
More compute can reduce runtime, but it often scales inefficient work. If a query reads unused columns, joins too early, or full-refreshes unchanged data, bigger infrastructure makes the waste more expensive.
What is the highest-impact optimization for analytics teams?
Start by reading less data. Remove unused columns, push filters early, use partition pruning, and convert row-heavy raw formats into columnar formats where appropriate.
How does this apply to marketing teams?
Marketing analytics depends on fast feedback loops. When campaign, attribution, audience, and budget data refresh slowly, teams make decisions later and manage fewer experiments with less precision.
Where should AI fit in data optimization?
AI should inspect real telemetry: queries, plans, table stats, file counts, runtime history, cost history, and SLAs. The output should rank fixes by expected impact and risk, not repeat generic tips.